Help

Below you will find the most frequently asked questions about the SBB statistics portal. For further questions or feedback please contact stat@sbb.ch.


The most important functions of the SBB Statistics Portal

The most important functions of the SBB Statistics Portal

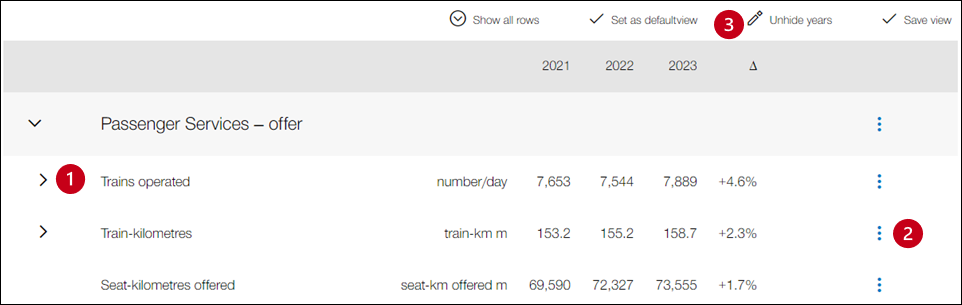
  1. Click on the arrow (>) at the start of a line to display the subordinate lines of the table with further information. On the computer, you can show all rows of a table by clicking on “Show all rows”.

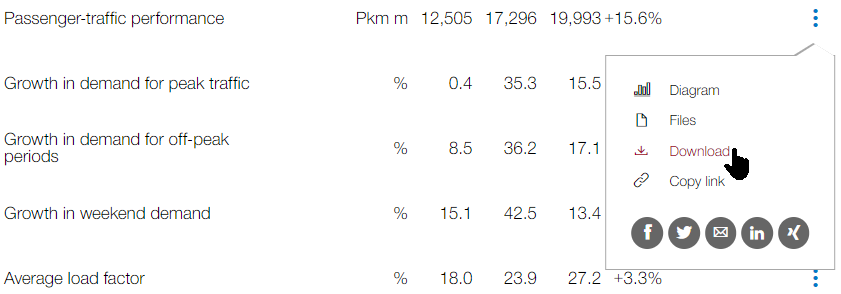
  2. Click on the three vertical dots to access functions for the current key figure: interactive diagram, download data and link to current table cell. If the three dots are blue, this indicates additional content: a PowerPoint diagram, open data, further references or a footnote.

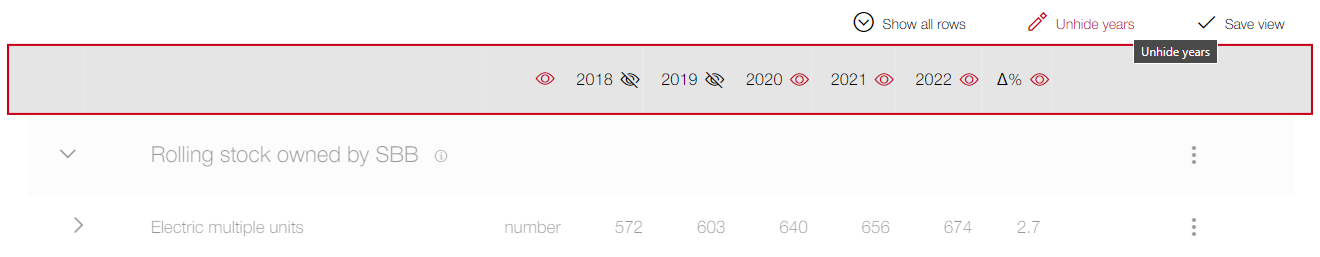
  3. On the computer, you can display a maximum of 5 years by clicking on “Unhide years”.


The figures are generally updated once a year for the SBB Annual Media Conference. This is held in mid-March each year. There are exceptions, however. For example, the figures for passengers boarding and alighting are updated in early summer.

You can download individual rows as a CSV file (“Download” icon).


How to download an individual row


A PDF with all the tables from the SBB Statistics Portal can be downloaded from the imprint.

On the computer, the “Unhide years” command can be used to display the last five years for a key indicator. If you are looking for older data, please contact stat@sbb.ch.

Unhide years

The glossary lists and explains the most important railway-specific terms and units.

A footnote provides an explanation of an additional reference for certain key indicators. Three blue dots indicate where this information is available.

On the computer, the “Save view” command will save the currently selected view. The opened rows and displayed years will therefore appear when you next visit the page.